

“Far more money has been lost by investors preparing for corrections, or trying to anticipate corrections, than has been lost in corrections themselves.” – Peter Lynch
The theme from last month ended up being ‘market volatility.’
Yes, there’s a lot going on in the world right now. War, spiking/falling/spiking oil prices, rising inflation, a potential pause in Fed rate cuts/a potential beginning of Fed rate hikes, a slowing labor market, AI-in-everything, and more.
But……the economy continues to move forward — just at a more measured pace.
Growth is still positive. The most recent data shows the economy expanding at roughly 2–3%, which is a healthy, sustainable level. Not overheated, but not stalling either. Consumers are still spending and businesses are still investing, just with a bit more discipline.
Inflation, while still above the Fed’s target, continues to gradually ease. Headline inflation is running around 3%, with core inflation slightly higher in the low-to-mid 3% range. Progress is being made — just slowly — which is why the Federal Reserve is staying patient.
The labor market remains a key pillar. Unemployment is holding near 4%, and job growth continues at a steady pace. Wage growth is still running around 4%, which supports consumer spending without signaling major overheating.
Interest rates are the balancing act. The Fed has kept rates in the 5.25%–5.50% range, choosing to wait for clearer confirmation that inflation is fully under control. Markets are still expecting rate cuts later this year, but the timing remains uncertain — and that uncertainty is what’s driving short-term volatility.
Housing continues to tell its own story. Mortgage rates remain elevated around 6.5%–7%, which has slowed transaction activity. But limited inventory continues to support home prices, which are still rising modestly year over year.
And the collective response from the stock market has been a blip on the radar: The S&P 500 was down just 6.8% from the highs at the lowest point this year. However, it feels like this drawdown is worse than it really is. In fact, you can’t even call this a ‘correction’ just yet; it’s merely a ‘pullback.’
(If you’ve been watching the financial media lately, you’d think a market collapse is always right around the corner. Turn on CNBC and you’ll hear confident predictions about what the market is going to do next — up, down, recession, soft landing, hard landing… take your pick. The reality is simple: no one knows. As the saying goes, market “experts” have predicted 20 of the last 5 corrections….)
Let’s level-set here with some commonly-accepted definitions in the economic world:
-5% = pullback
-10% = healthy correction
-15% = correction
-20% = bear market
-30% = collapse
-40% = crash
-50% = crisis
And now, a short history of stock market pullbacks:
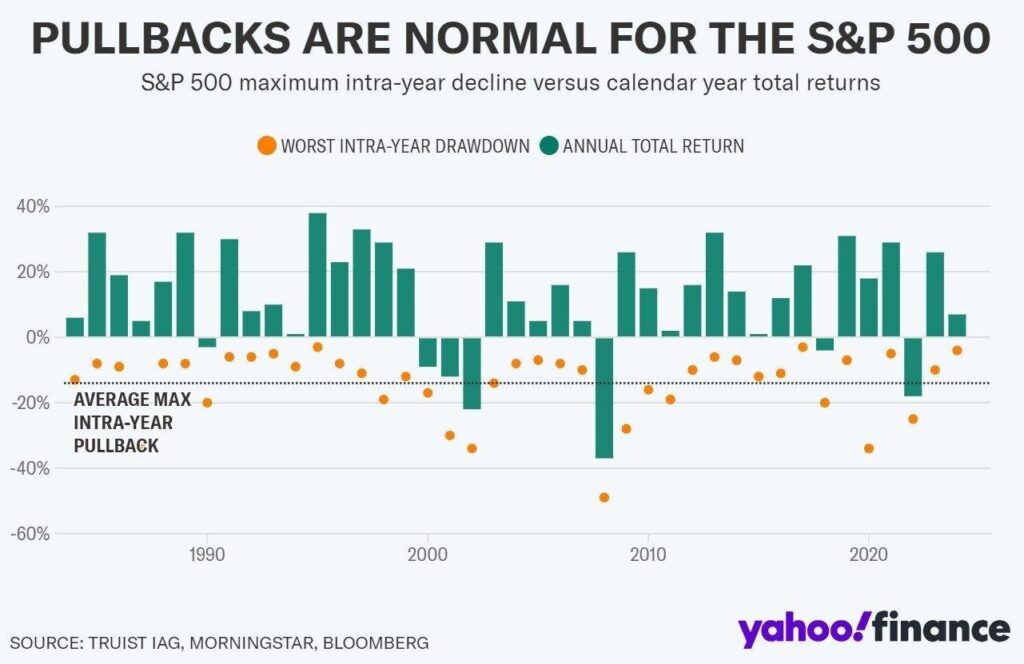
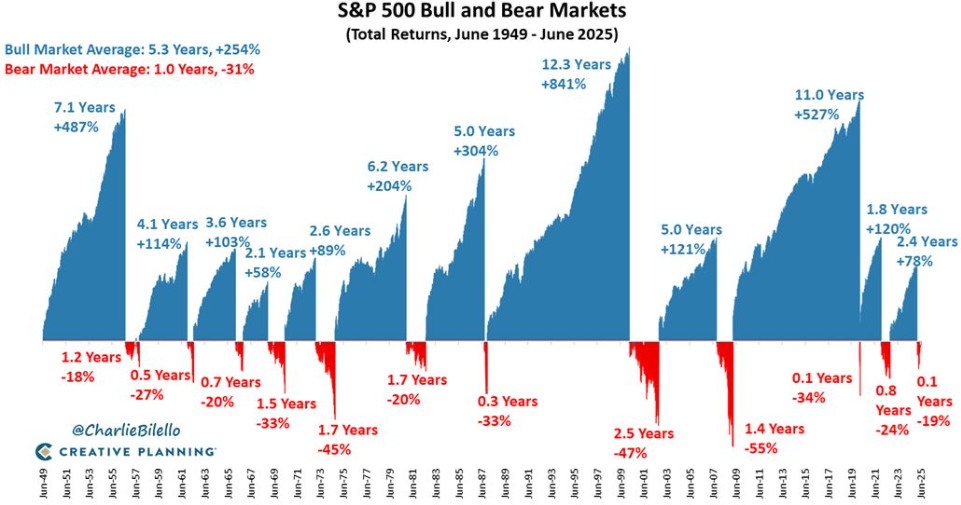
Below are two charts that help put recent market volatility into proper perspective and reinforce what long-term investors should expect.
The first chart highlights an important reality: pullbacks happen every year. The S&P 500 routinely experiences intra-year declines—often in the range of -10% to -15%—yet most calendar years still finish positive. The takeaway is straightforward: volatility is not a warning sign, it’s a normal part of how markets operate. The path to long-term returns is uneven, and short-term declines are simply part of the process.
The second chart puts that volatility into proper perspective by showing the relationship between bull and bear markets over time. Bull markets tend to last significantly longer and deliver much larger cumulative gains, while bear markets are typically shorter and less impactful in duration. This imbalance is what drives long-term portfolio growth and reinforces why staying invested matters.
From a planning standpoint, the implication is clear: reacting to short-term market movements is often more harmful than helpful. The strongest returns tend to occur in concentrated periods during bull markets, and missing even a few of those periods can significantly reduce long-term results. Market declines are not signals to exit—they are the cost of participating in long-term growth.
- Pullbacks occur every year and are entirely normal
- Most years end positive despite intra-year declines
- Bull markets last longer and generate the majority of returns
- Bear markets are shorter and part of the cycle
- Missing upside is a greater risk than experiencing volatility
- Discipline—not timing—drives long-term success
Portfolios
From a portfolio standpoint, this environment reinforces why we are positioned the way we are. On the equity side, we remain overweight U.S. equities, with a focus on quality and large-cap exposure (IVV, QGRW), while maintaining meaningful allocations to mid and small caps (IJH, IJR) that have lagged but historically tend to lead in the next phase of the cycle. International exposure (IEFA, IEMG, DDWM) remains a diversifier, with an emphasis on dynamic currency management rather than making a directional bet on the dollar.
We are not making portfolio changes based on headlines or short-term market moves. The current backdrop — steady growth, moderating inflation, and a patient Fed — supports a fully invested, diversified approach. Our tilt toward quality and broad market exposure allows participation in continued strength without relying on a narrow group of stocks, while exposure to mid and small caps positions the portfolio for a potential broadening of market leadership.
On the fixed income side, we are positioned with a neutral duration profile, but intentionally tilted toward higher-quality credit, municipals, and mortgage-backed exposure, while remaining underweight traditional government bonds. With yields still elevated relative to the past decade, bonds are once again serving their purpose — providing meaningful income, stability, and balance alongside equities.
Across both asset classes, the focus remains consistent: balance, discipline, and positioning for a range of outcomes — not a single prediction.
We will be rebalancing portfolios next week – so please look out for the trade confirmation emails.
For Further Reading:
What Is IRS Form 5498 — And Why It Matters for IRA Owners
What to Do With Unused 529 Plan Assets: A Decision Framework for High-Net-Worth Families
Bill